Published date:
October 21, 2026
An independent brand archetype audit of 21 payment and fintech brands. I scored what each brand says about itself and what its website actually shows, then mapped which brands look high-risk and why.
I wanted a firmer view of what makes a fintech brand look trustworthy, and what quietly makes it look risky.
Teams I've worked with had tried to analyse their own brand before. The attempts stalled, and nobody could say why. The missing piece was a shared reference point. Without one, every opinion about a brand is a matter of taste.
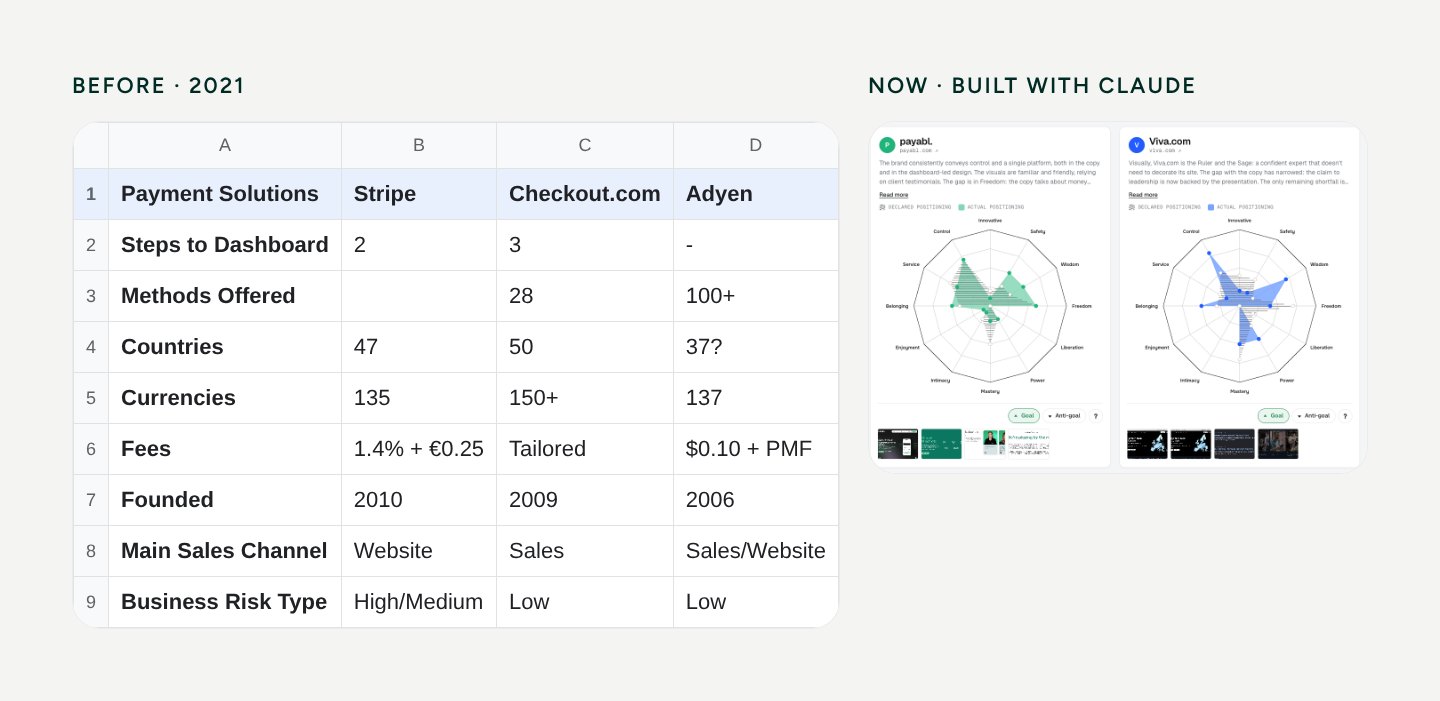
About five years ago my competitor analysis was a spreadsheet: 21 providers in columns, and rows for fees, countries, currencies, onboarding steps and business risk type. Useful for product decisions. Silent on how a brand is perceived.
This time the question was different: what does this brand make me feel, and does that match what it says? To answer that, I needed a model, a score for every brand and one picture a whole team could read. Claude helped me build that picture quickly: the charts, an editor to adjust scores and previews to run the team discussion.
12 archetypes. The model already existed: from Creator to Ruler, each with visual and verbal criteria. Sage means white space, tables, serif type and facts. Magician means gradients, dark themes and "magic in one click".
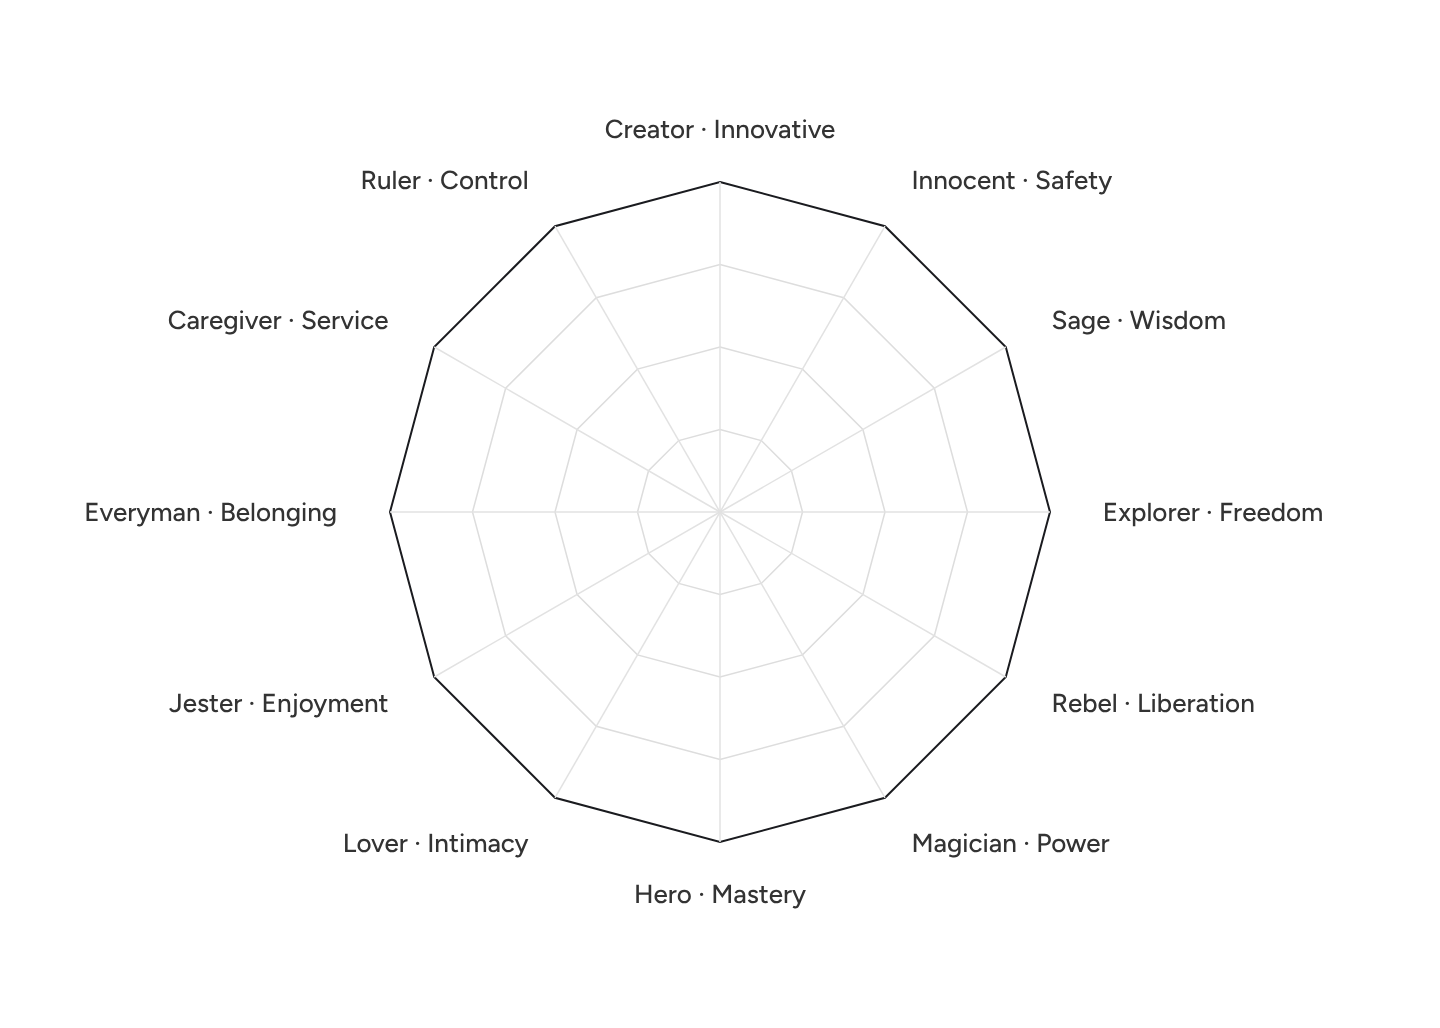
A budget of 40 points. This part is mine. Every brand gets exactly 40 points to spread across the 12 archetypes, with a maximum of 10 on each. Without a cap every brand scores high on everything and the chart becomes unreadable. With a budget, scores show emphasis: what the brand chooses to be.
Two layers. Each brand is scored twice: declared (what the copy claims) and actual (what colour, type, imagery and layout communicate). The gap between the two is the interesting part.
Human first, then AI. I built the first archetype chart and scored the first 10 brands by hand. Claude then scored the remaining 11 against the same criteria.
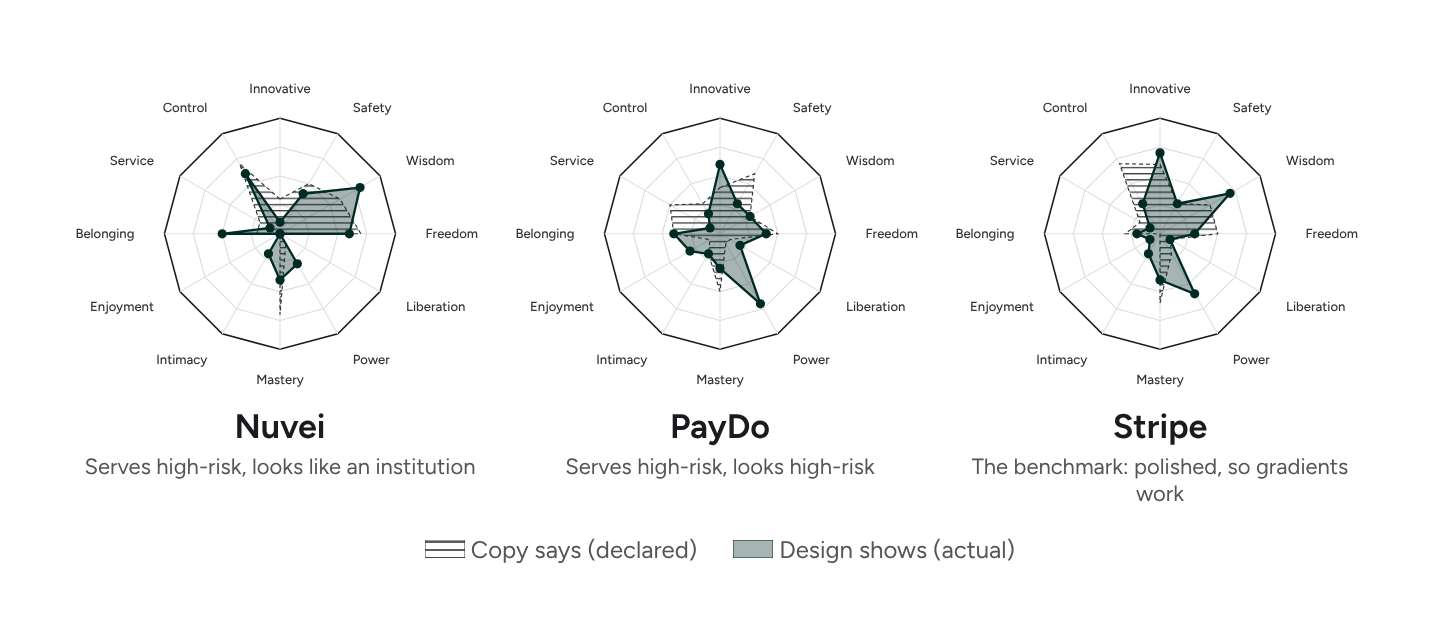
Archetypes are not the one correct way to analyse a brand. They are a common language and a coordinate system for a team. Once everyone looks at the same chart, concrete decisions about the brand get much easier.
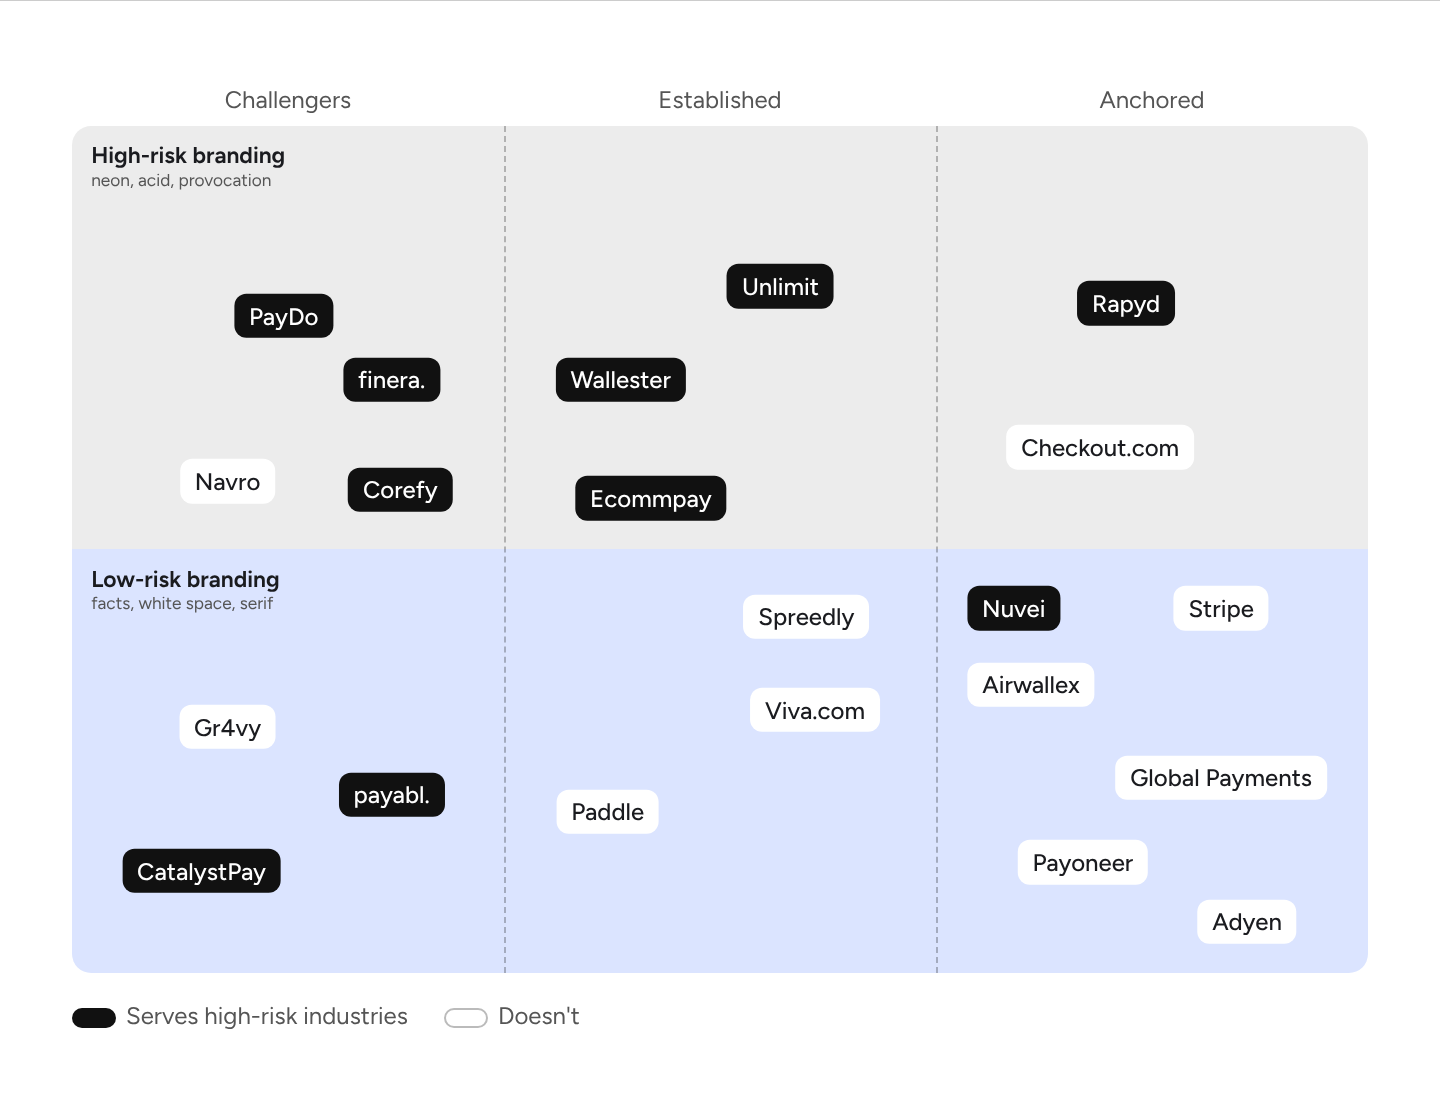
Three things stand out:
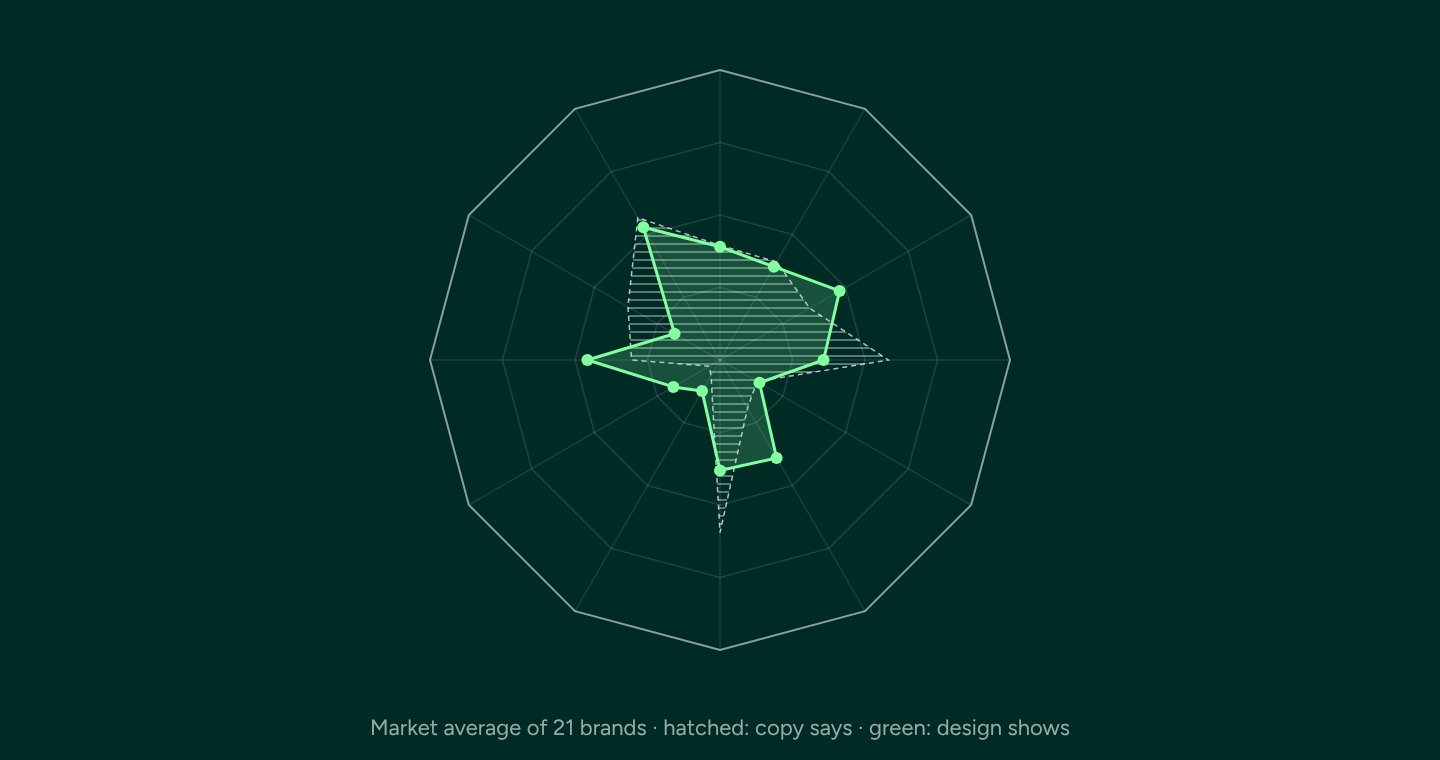
Averaged across all 21 brands, these are the biggest gaps between copy and design.
In plain words: fintech copy promises "no borders", "we are the best" and "we will take care of you". The design rarely shows any of it. Instead it reaches for gradients, dark themes and glowing 3D. Support is promised in the text and almost never shown.
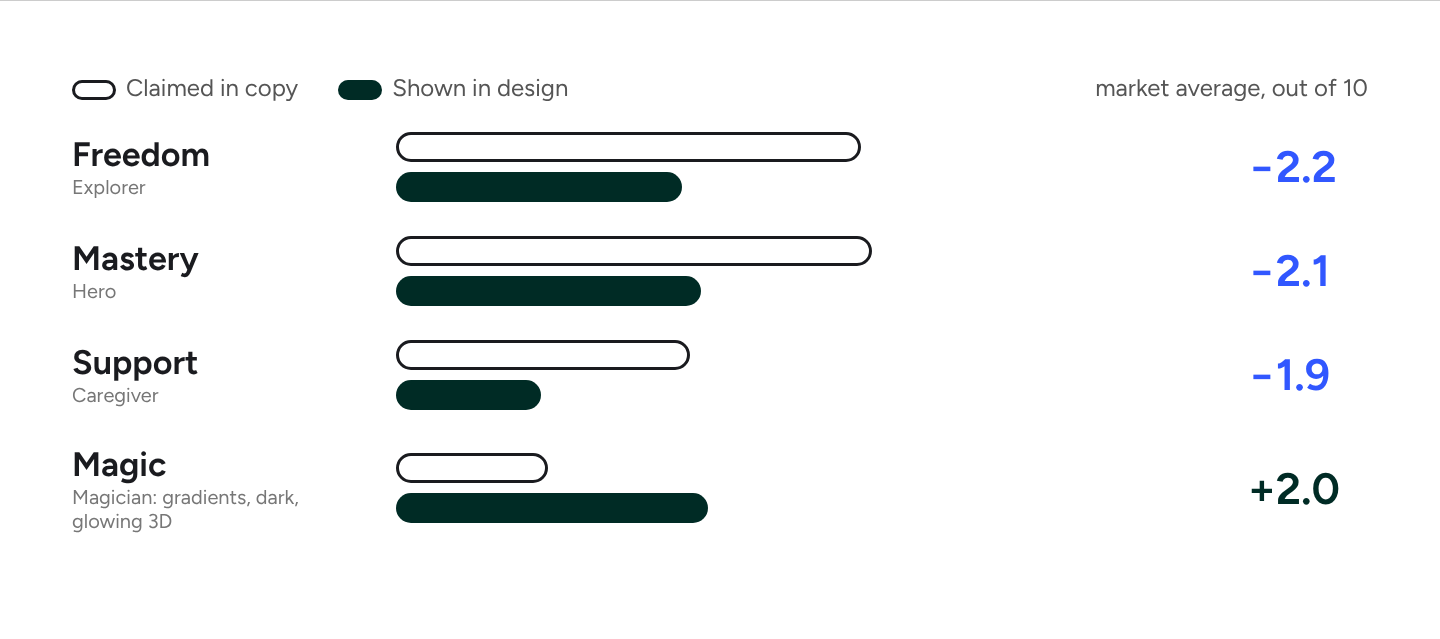
Brands that serve high-risk industries (crypto, trading, iGaming, forex) often share the same look:
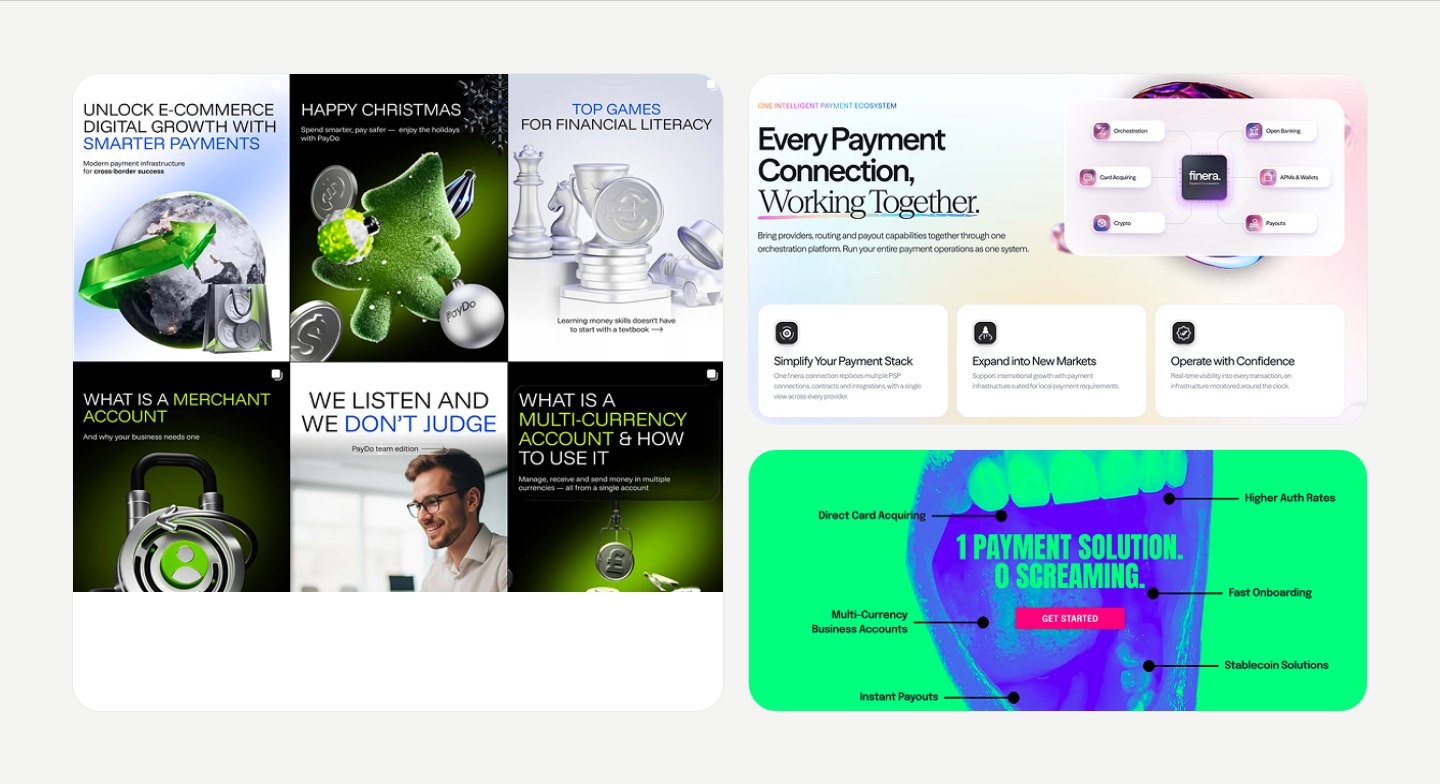
The code is not only visual. A brand reads as high-risk when its claims cannot be checked: tools that never appear in the documentation, numbers with no source, a site that claims more than the visible team can deliver.
The logic is simple. An unverifiable claim raises a question. A question creates suspicion. Suspicion reads as risk. In this audit it was a recurring pattern.
Most of these are not strategy problems. They are basic hygiene:
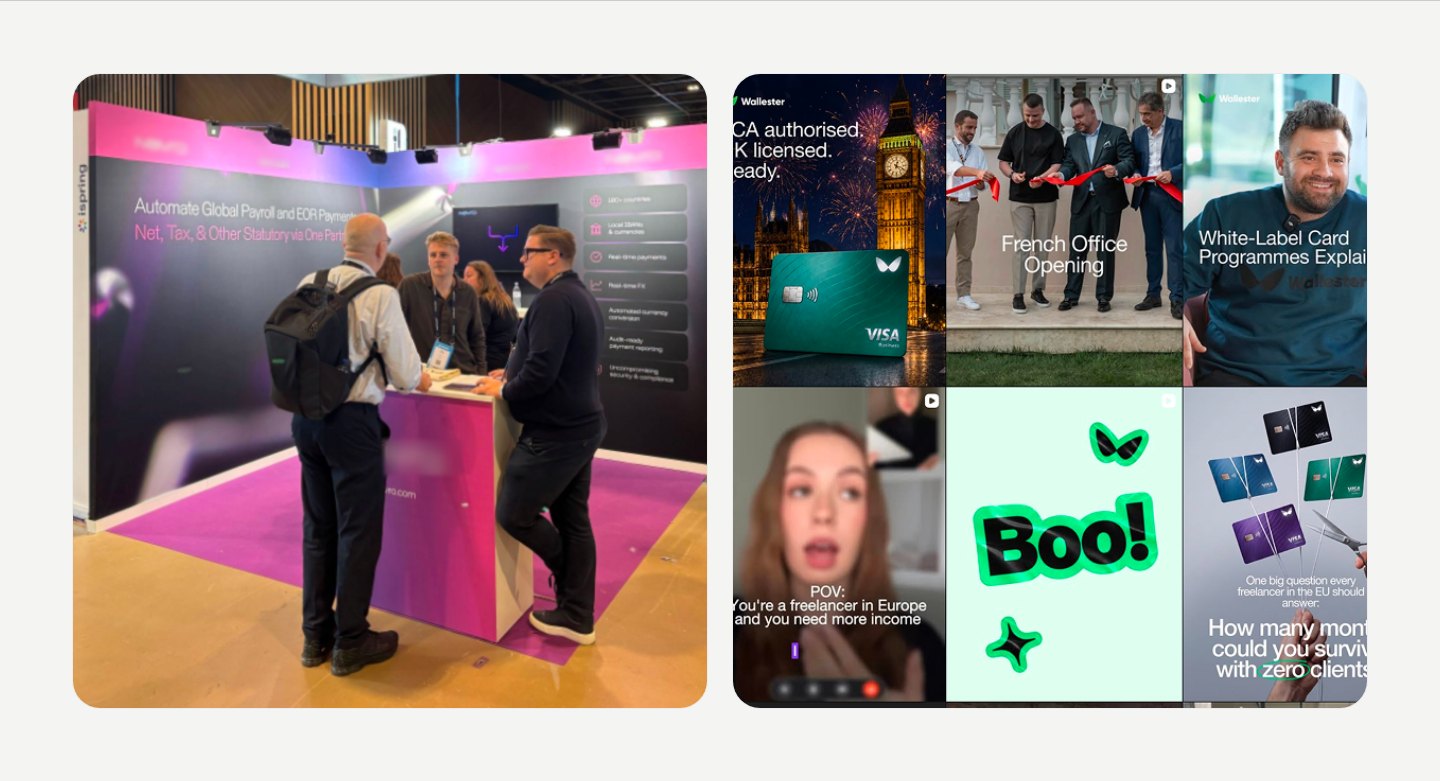
None of these on its own loses a client. Together they read as a brand that is hiding something.
Look at the right column of the map: Adyen, Stripe, Global Payments, Checkout.com. They have a strong visual base, but what really carries them is hard to copy:
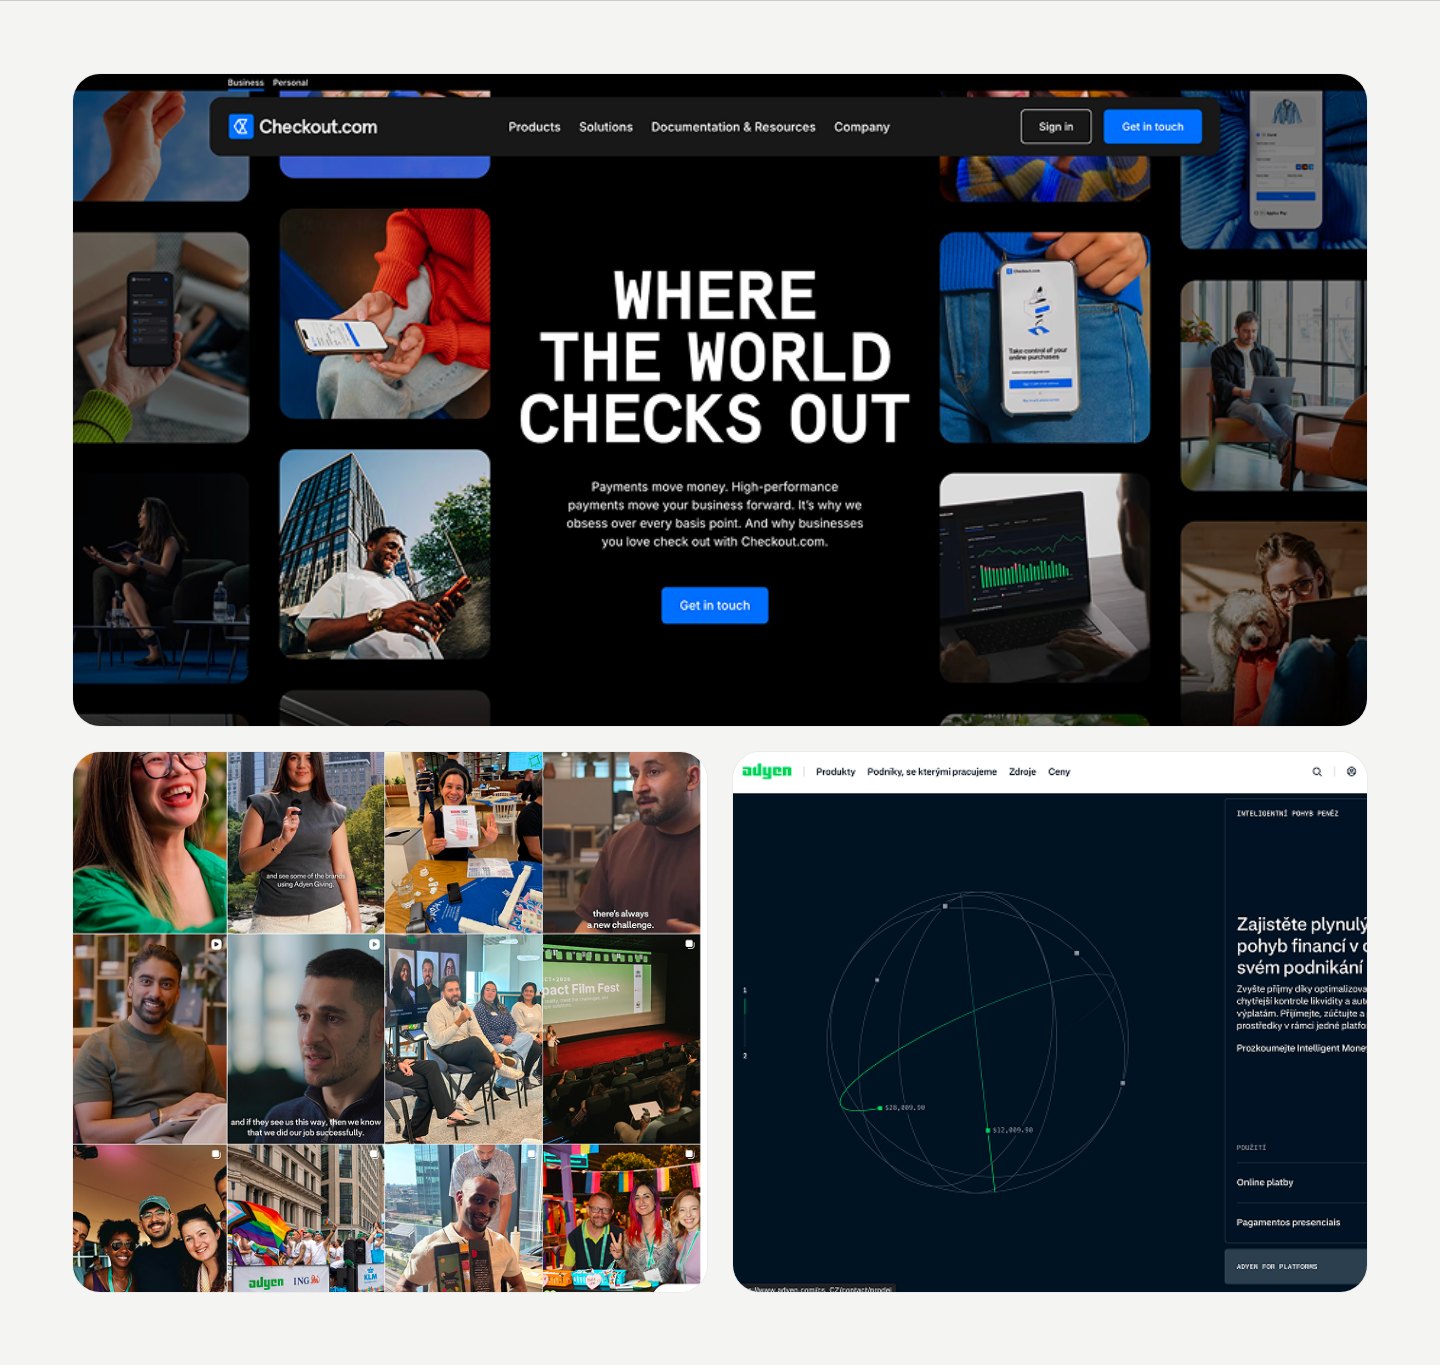
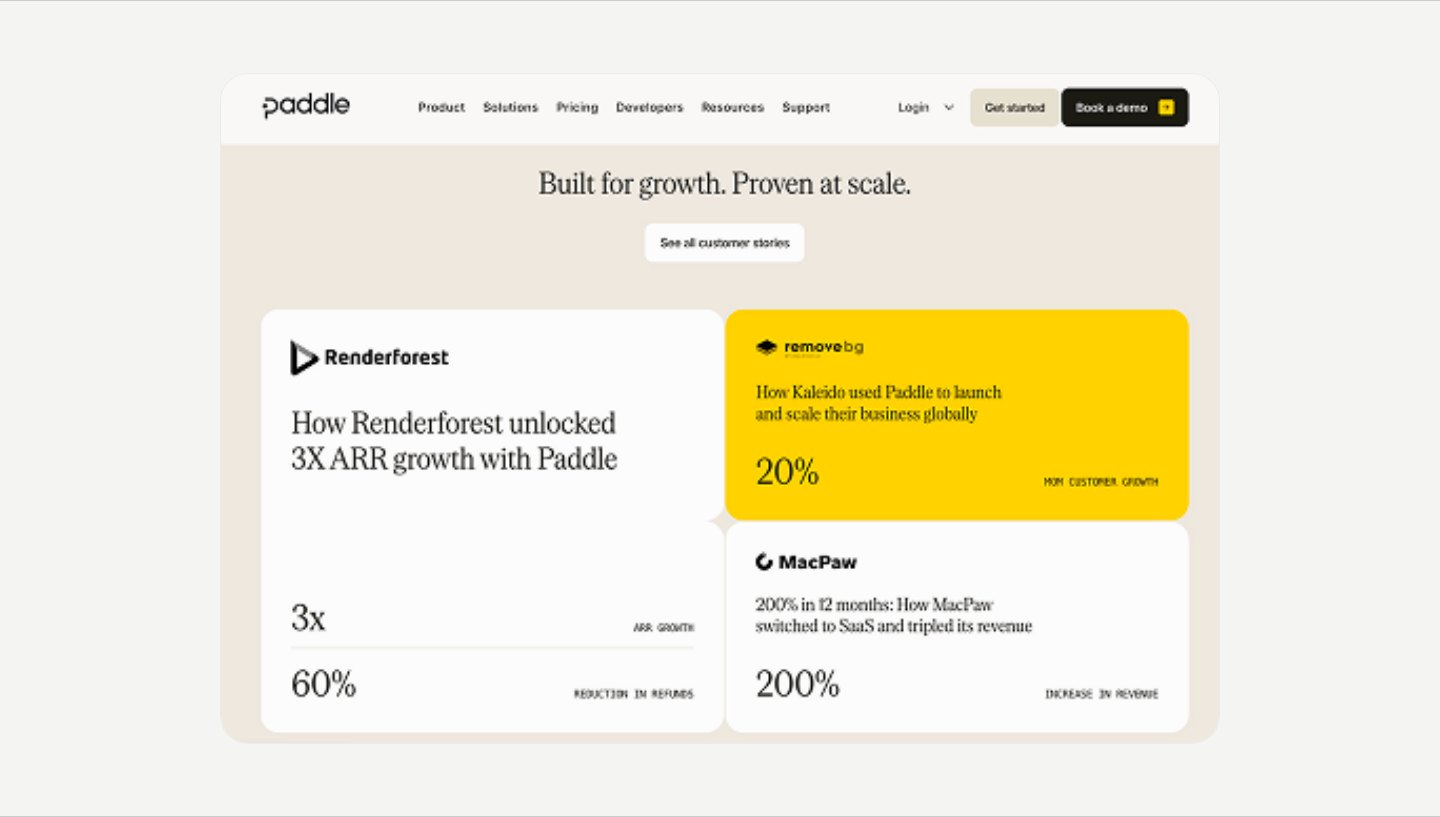
Their restraint works because every claim is backed. Scale also buys freedom: Rapyd and Unlimit can afford provocation and acid lime. For a small player the same look reads as a crypto casino.
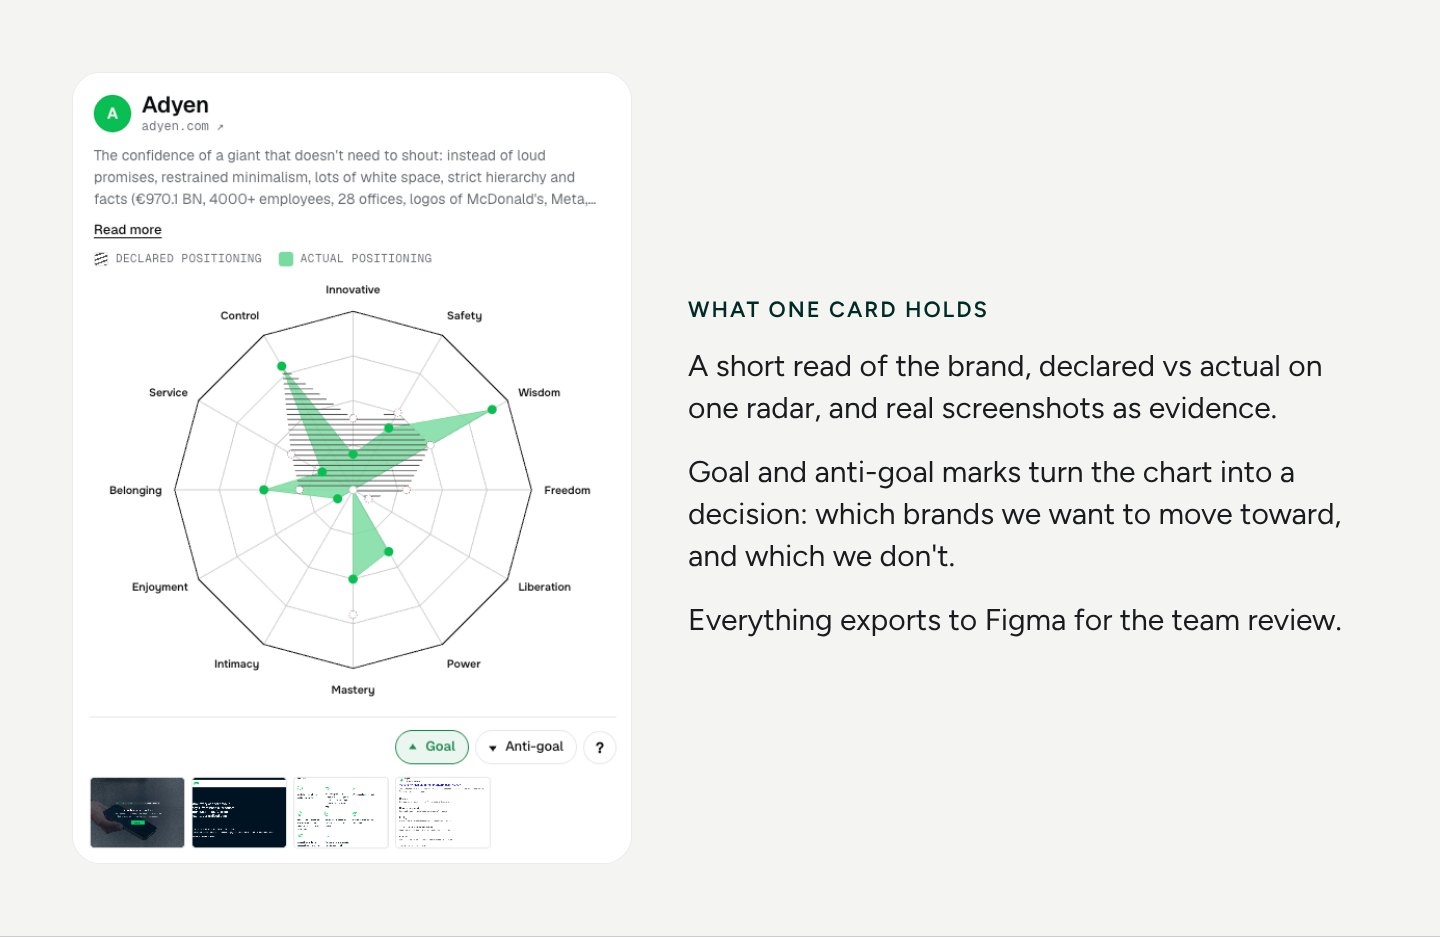
AI made the heavy part fast: the charts, the scoring editor and the previews for the team. It also drafted scores once the criteria and the first 10 brands were set by hand.
It could not do the analysis on its own. It can't tell that a booth doesn't match the claims, that the team looks smaller than the site, or that a polished 3D render is covering for a small company. That still takes a person looking at the brand and checking the conclusions against what they see.
Founders: your brand already has a risk score in the client's head. Every claim you can't back costs trust. Check your own site against the list above.
Marketers: proof beats style. Real photos, named clients, checkable numbers and visible support do more than another gradient.
Designers: analysis is part of the job, not a pre-step. Give the team a shared model, score honestly, and look at the brand with your own eyes before you trust any tool.
Scores are expert judgements made from each brand's website, not measured data. The goal is a shared picture for discussion, not a ranking.
I share research, tools and design notes on LinkedIn.
Follow along to see the next one.